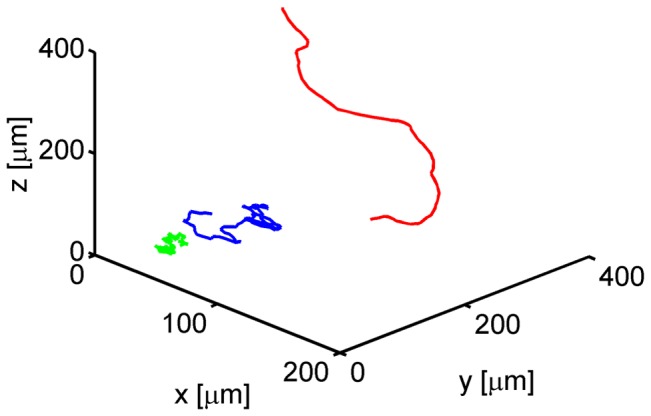
Figure 4. Examples of cell tracks from different sub-populations.

One cell track for each type of migration behavior is shown: a fairly straight cell track (type 1, red), a strongly confined cell track (type 2, green) and a purely random cell track (type 3, blue).
