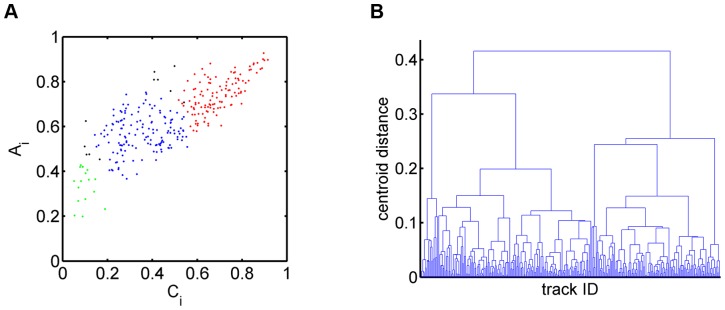
Figure 9. Hierarchical clustering of neutrophil cell tracks in the parameter space of two staggered measures.

(A) Sub-populations of cell tracks in the space spanned by the average confinement ratio and the average volume asphericity: fairly straight cell tracks (type 1: red), strongly confined cell tracks (type 2: green) and purely random cell tracks (type 3: blue). In going from 2D to 4D clustering, eleven cell tracks change sup-populations from type 1 to type 3 and from type 3 to type 2 (indicated in black). (B) Dendrogram obtained from the agglomerative hierarchical clustering based on the euclidean distance between the centroids of groups of data points.
