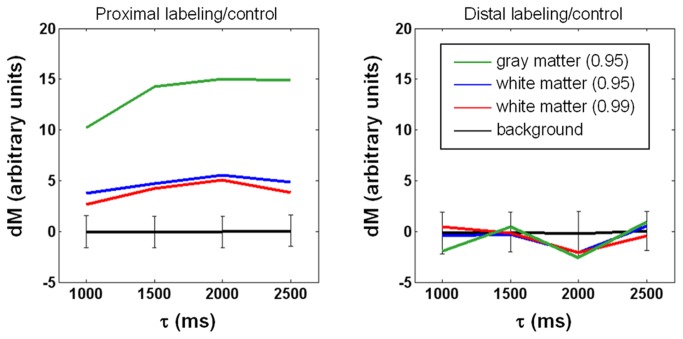
Figure 2. Dependence of perfusion-weighted signal intensity (dM) on tagging duration (τ).
Post-labeling delay = 1800 ms. Data is obtained from the 6th slice of the subject in Figure 1. Regions of interest are determined at a probability of 0.95 for gray matter (green lines), and both 0.95 and 0.99 for white matter (blue and red, respectively). In both panels, background signals are zero on average with standard deviation (i.e., noise) shown in error bars. The right panel indicates that labeling/control pulses cause negligible flow-irrelevant signal perturbation.

