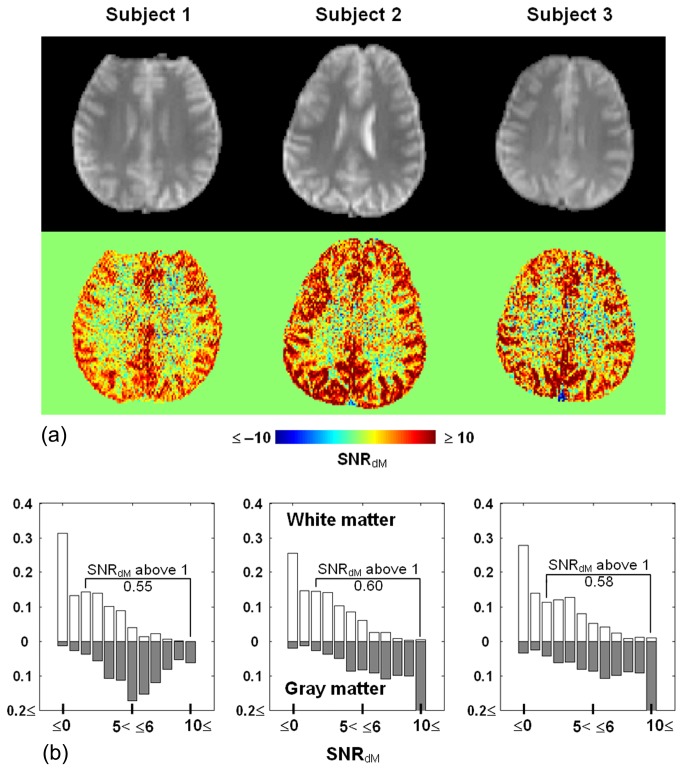
Figure 4. Maps (a) and histograms (b) of perfusion-weighted signal to noise ratio (SNRdM) obtained in three representative subjects (slice 6).
Echo-planar images at the same location are shown for anatomical reference (upper row). In (b), white bars = white matter, gray bars = gray matter. The proportion of white matter voxels with SNRdM above unity is 0.55, 0.60, and 0.58, respectively.

