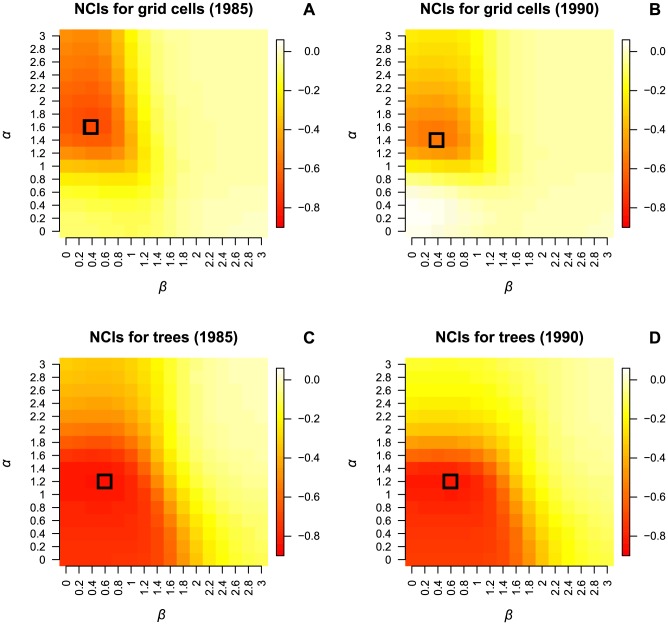
Figure 1. Correlation between log(canopy index) and neighborhood competition indices with different values of α and β.
The correlation is based on the canopy index and neighborhood competition indices (NCIs) for 16,544 5×5 m grid cells (A, B) and for 135,788 (C) and 139,625 trees (D) in the BCI forest plot. For grid cells, the highest correlation was achieved with α = 1.6 and β = 0.4 in the first, and α = 1.4 and β = 0.4 in the second census (highlighted). For individual trees, the highest correlation was achieved with α = 1.2 and β = 0.6 (highlighted) in both censuses. Colors indicate Pearson's r.

