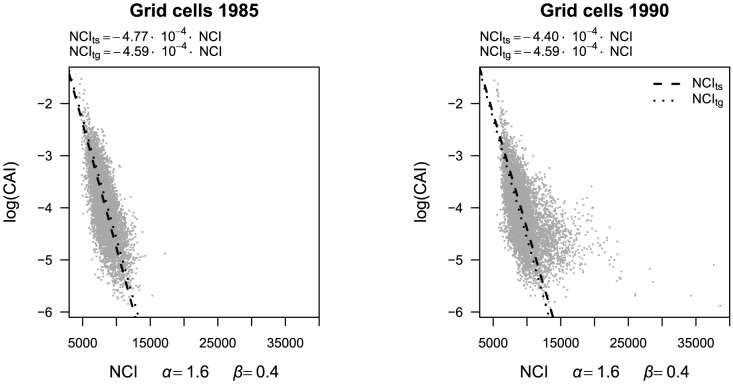
Figure 2. Best neighborhood competition index (NCI, α = 1.6, β = 0.4) versus canopy index (CAI).
Lines show quantile regressions to convert neighborhood competition index (NCI) into an interval-specific estimate of log(canopy index) (NCIts, dashed line) or into a general estimate of log(canopy index) which is based on pooled data from both census intervals (NCItg, dotted line).

