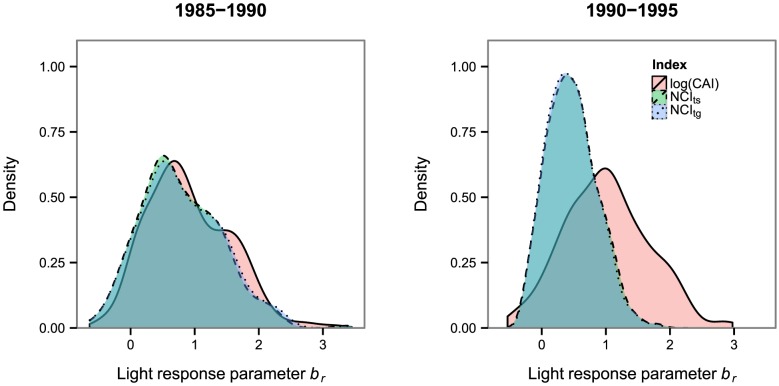
Figure 4. Community-wide distribution of the light response of recruitment (br).
Light is estimated either with the canopy index (log(CAI)), the interval-specific neighbordood competition index (NCIts) or the general neighborhood competition index (NCItg). The underlying histogram can lead to sharp edges of the density plot.

