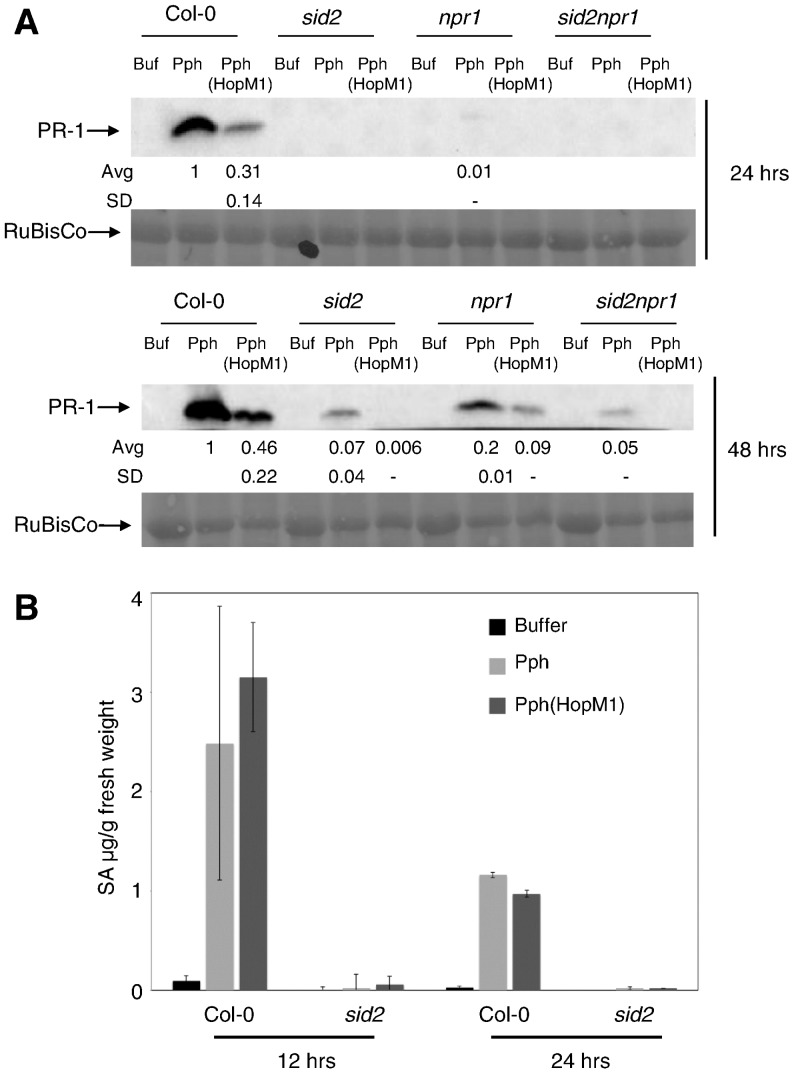
Figure 2. HopM1 suppresses Pph-induced PR-1 expression in SA-signaling deficient backgrounds.
A) Col-0 and SA-signaling mutant plants were infiltrated with buffer, Pph, or Pph (HopM1) and the amount of PR-1 protein was measured by immunoblotting at 24 and 48 hai. Quantified data were normalized with the amount of PR-1 induced by Pph in Col-0 set to 1. The average and standard deviation of values from three independent biological replicates are shown below the PR-1 blot. SD values for those samples that showed detectable PR-1 levels in only one replicate are not calculated (-). Ponceau stains of the membranes demonstrating equal protein loading are shown below. B) Plants were treated as in (A) and SA levels in leaves were measured at 12 and 24 hai. Shown is the combined data from three independent biological replicates and error bars represent standard deviations.

