
Figure 3. AtMIN7 positively regulates Pph-induced PR-1 transcript accumulation without affecting accumulation of SA.
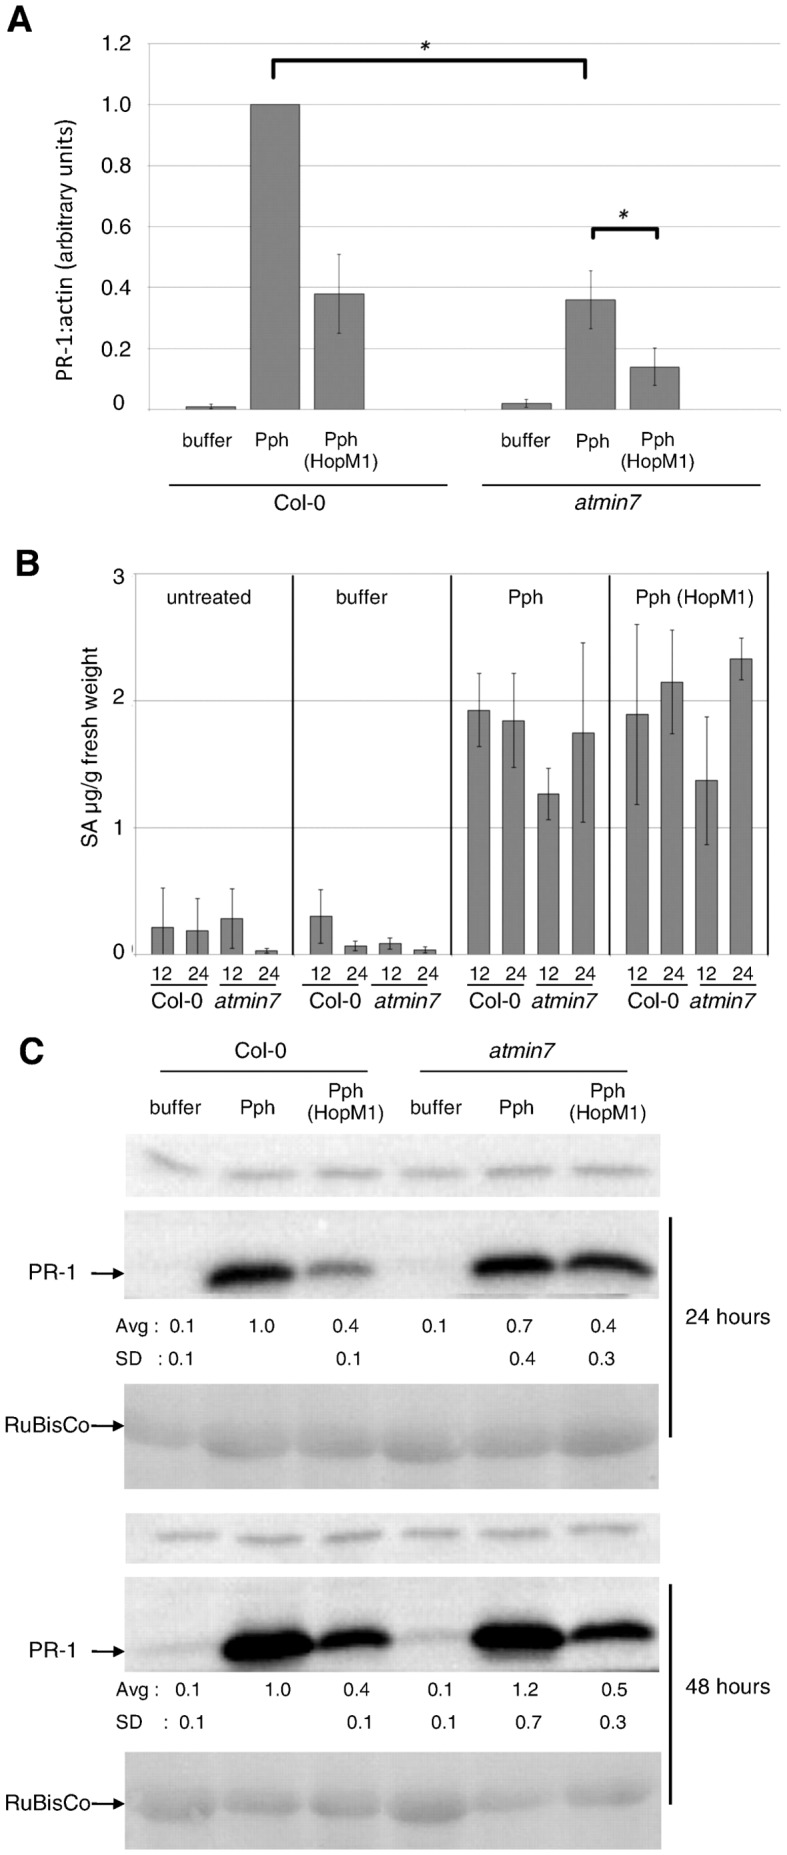
A) Col-0 or atmin7 plants were infiltrated with buffer, Pph, or Pph (HopM1). PR-1 transcript levels were measured by qRT-PCR at 28 hai. The graph shows combined data from three independent biological replicates normalized with Pph in Col-0 set to 1. Paired two-tailed t-tests indicate significant differences between PR-1 transcript levels induced by Pph in Col-0 versus atmin7 and by Pph versus Pph (HopM1) in atmin7 plants (*, P<0.001). B) Plants were treated as in (A) and SA levels in leaves were measured at 12 and 24 hai. Shown is the combined data from three independent biological replicates and error bars represent standard deviations. Paired two-tailed t-tests indicate that SA levels induced by Pph in Col-0 versus atmin7 differed at 12 hai (P = 0.03) and that differences with Pph versus Pph (HopM1) in Col-0 or atmin7 were not apparent at 12 or 24 hai (P≥0.5). C) Plants were treated as in (A) and total protein samples from 24 and 48 hai were subjected to anti-PR-1 immunoblotting. Quantified data were normalized with the amount of PR-1 protein induced by Pph in Col-0 set to 1. The average and standard deviation values for four independent biological replicates are shown below the blots. Paired two-tailed t-tests did not show significant differences between PR-1 levels in Col-0 versus atmin7 plants infiltrated with Pph or Pph (HopM1) (P≥0.3). The cross-reacting band above PR-1 and ponceau staining of RuBisCo indicate equal loading of samples.