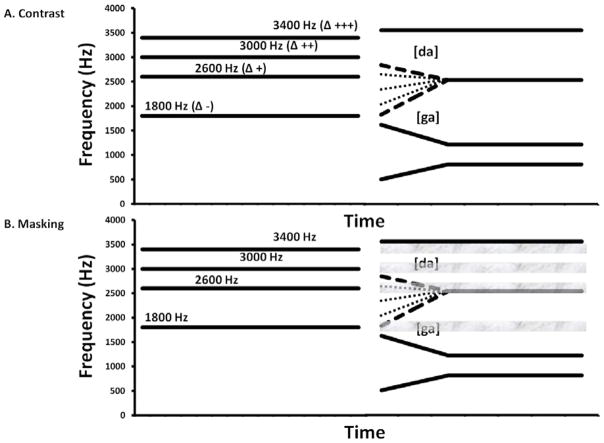
Figure 1.
The predictions of the competing accounts are depicted. Several precursor tones are displayed, but the predictions apply to the presentation of one precursor tone in isolation. The contrast account (top panel) predicts effects on the manipulated F3 transition that results in the [da-ga] continuum. The contrast account predicts that precursor tones at a frequency greater than that of F3 should cause F3 to be perceived as lower than its true frequency, resulting in more “g” responses. Thus, the 2600, 3000, and 3400 Hz tones should all increase “g” responses. (The direction of the frequency difference between precursor and target is indicated by the sign after Δ and the magnitude by the number of signs.) The 3000 and 3400 Hz tones should produce at least as many “g” responses as the 2600 Hz tone (or possibly more if the change in “g” responses is proportional to the frequency difference). The 1800 Hz tone is predicted to produce the fewest “g” responses because of its lower frequency relative to the targets’ F3 onsets. The masking account (bottom panel) provides an alternative explanation, and predicts that the precursor tones’ effects are to mask information in a frequency band centered at the tone frequency. The grey bars schematize the hypothesized regions of maximum influence of each tone. The masking account predicts that the two highest frequency tones’ interference in detecting [da]s diminishes progressively with increased distance from the F3 onset of [da]. (In the figure, the bands extend throughout the entire syllable, because their actual duration is unknown; what really matters is their effect near syllable onset.) The higher tones should thus produce progressively weaker shifts relative to the 2600 Hz tone (which should interfere strongly with detecting [da]). The 1800 Hz tone interferes strongly with the detection of [ga] and thus produces the fewest “g” responses..

