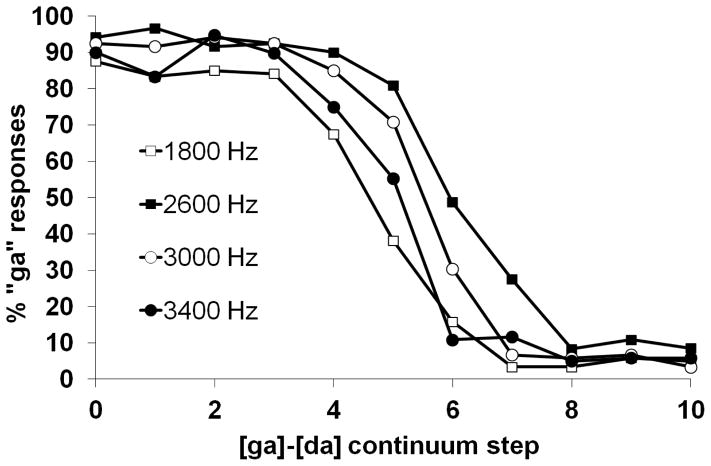
Figure 2.
“Ga” responses as a function of precursor tone and continuum step. Square symbols denote tones in typical F3 region that produce strong boundary shifts. In this case, the higher F3 analogue (2600 Hz, filled square) produces the most “g” responses. Circular symbols denote tones that are placed away from the F3 region (F4 analogues), and they produce comparatively weaker effects. In this case, the higher F4 tone (3400 Hz, filled circle) produces fewer “g” responses than the lower F4 tone (3000 Hz, open circle).

