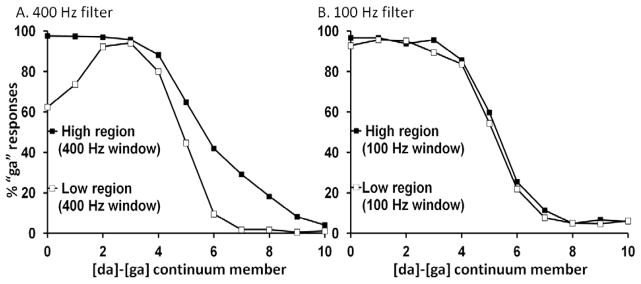
Figure 5.

Effects of removing hypothesized masked frequencies from the target continuum on target categorization. Panel A shows stronger effects of using a 400 Hz filter window to represent masking effects that follow typical high intensity tone analogues. Panel B shows weaker effects of using a 100 Hz filter window to represent masking effects of lower F3 intensity tone analogues.
