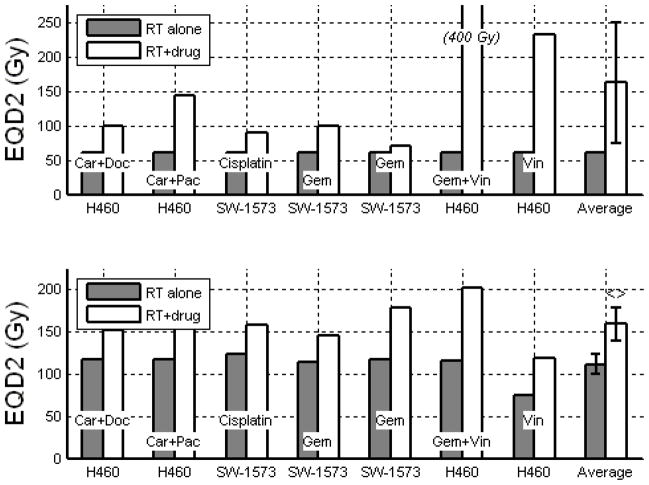
Figure 5.
EQD2 for NSCLC cell lines treated with 2.0 Gy x 30 (top) and 10.0 Gy x 5 (bottom). Car = Carboplatin, Doc = Docetaxel, Pac = Paclitaxel, Gem = Gemcitabine, Vin = Vinorelbine. Error bars indicate 95% confidence intervals. <> denotes a significant (p<0.05) increase in EQD2 with the addition of drug using paired Student’s t-test.

