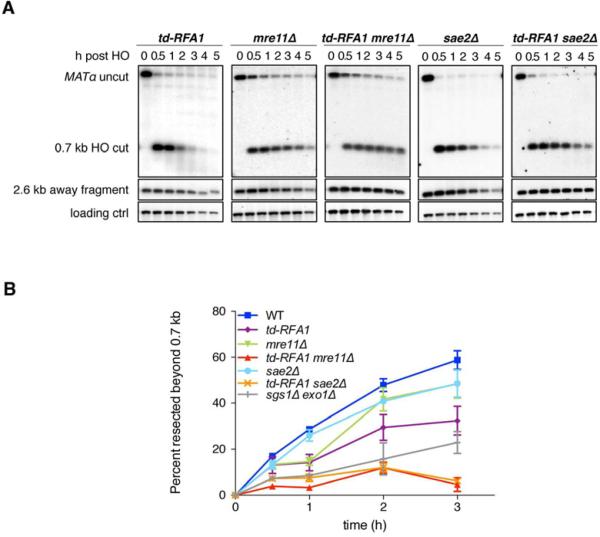
Figure 2. MRX-Sae2 and RPA act sequentially in end resection.
A synergistic defect of td-RFA1 and mre11Δ or sae2Δ in resection was seen by both the band disappearance assay (A) and qPCR (B). Plot showing the ratio of resected DNA (0.7 kb fragment) amongst the HO cut DNA at each time point by qPCR analysis. The mean values from 3 independent trials are plotted and error bars show SD.

