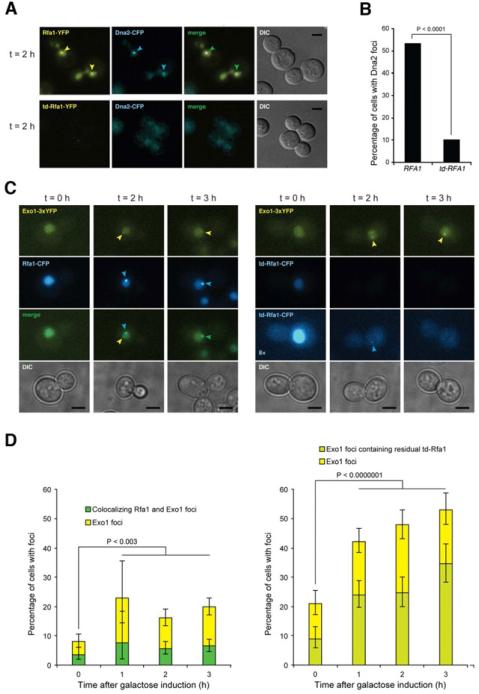
Figure 4. RPA is required for Dna2 but not for Exo1 localization to DSBs.
A. Epifluorescence microscopy showing DSB induced foci formation of YFP-tagged Rfa1 or td-Rfa1 and Dna2-CFP in G2/M arrested cells. Arrowheads indicate foci. Scale bar is equal to 3 m. B. Quantitation of Dna2-CFP foci. The percentage of cells with Dna2 foci was quantitated for the experiment shown in panel A, of which more than 90% co-localized with RPA. C. Exo1 focus formation is independent of Rfa1. Exo1-YFP and Rfa1-CFP or td-Rfa1-CFP were monitored before (t = 0) and 2 or 3 h after HO expression in G2-M-arrested cells. The left panel shows Rfa1-CFP cells and the right panel shows td-Rfa1-CFP cells. For the CFP channel, an 8-fold contrast enhanced version of the images from td-Rfa1-CFP cells are shown to illustrate that some cells contain weak residual Rfa1 foci that co-localize with Exo1 (t = 2), while other cells exhibit an Exo1 focus even in the complete absence of detectable td-Rfa1-CFP. D. Quantitation of Exo1 and Rfa1 foci. For the experiment in panel C, 200-600 cells were examined for Exo1 and Rfa1 foci at each time point. Error bars indicate 95% confidence intervals. Significance was determined by Fisher's exact test. See also Figure S4

