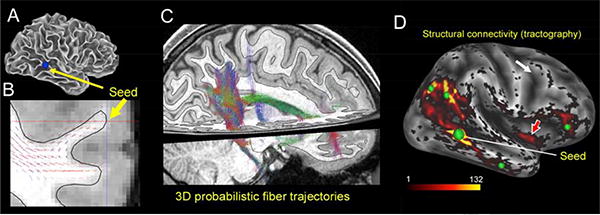
Figure 4.

Diffusion MRI and probabilistic tractography results in an individual HCP subject. A. Lateral view of the ‘gray/white’ surface, showing a seed location in the inferior frontal gyrus (IFG, blue dot). B. Probabilistic streamlines in white matter on a coronal slice that intersects the IFG seed point. C. Probabilistic trajectories from the IFG seed point viewed in a 3D volume. D. Structural connectivity from the IFG seed point (large green dot) viewed on the inflated cortical surface. Smaller green dots indicate the approximate centers of patches showing high structural connectivity with the seed point. Red arrow indicates a likely false positive patch in insular cortex. Adapted, with permission, from Van Essen et al., 2013).
