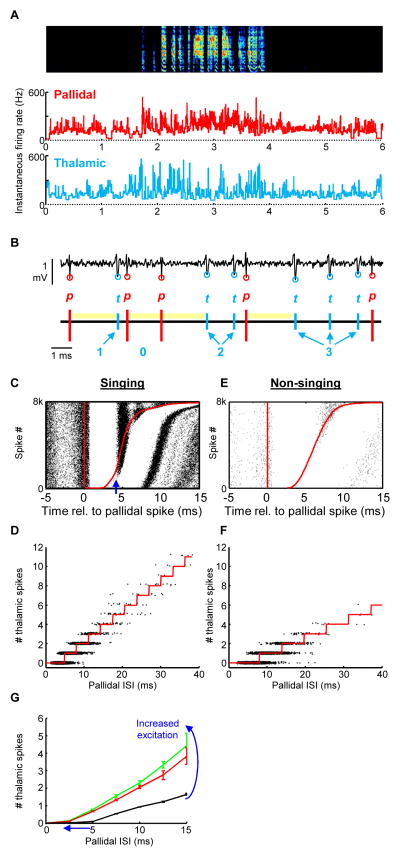
Figure 3. High frequency entrainment of thalamic neurons by pallidal inputs in the singing bird.
(A) Instantaneous firing rates of a thalamic neuron (blue) and its simultaneously recorded pallidal terminal (red) plotted during a bout of song (spectrogram shown above, dph 45). Note that both thalamic neuron and its pallidal input fire in concert at more than 100 spikes per second. (B) Example of extracellular waveform containing signals from a thalamic neuron (blue circles) and its presynaptic pallidal axon terminal (red circles). Bottom, schematic of the pallidal and thalamic spike trains. Yellow bars represent periods of thalamic spike suppression following the pallidal spike. The number of thalamic spikes that occurred in each pallidal interspike interval is annotated in blue. (C) Raster plot of thalamic spikes (black ticks) aligned to the timing of pallidal spikes (red line). Red line at right shows the time of the next pallidal spike. The plot is sorted by the duration of the pallidal ISI (n=8000 ISIs during singing). Note that each pallidal spike is followed by a brief period of absolute thalamic spike suppression. (D) The number of thalamic spikes that discharge within a pallidal ISI is plotted as a function the pallidal ISI’s duration (data are from singing periods). Red line indicates the number of thalamic spikes predicted to occur based on a simple mathematical model incorporating the pallidal ISI duration and the amount of excitation that the thalamic neuron receives (see Goldberg et al., 2012 for more detail). (E–F) Data are plotted as in C–D for non-singing periods, when there is less corticothalamic excitation. (G) The average number of thalamic spikes that discharged within a pallidal ISI is plotted against the duration of that ISI, for three different levels of corticothalamic activation: nonsinging periods (black), and the periods prior to syllable onsets (green) and offsets (red). Excitation of the thalamic neuron has the effect of increasing the slope and decreasing the x-intercept of this plot. This figure is adapted from (Goldberg and Fee, 2012; and Goldberg et al, 2012).

