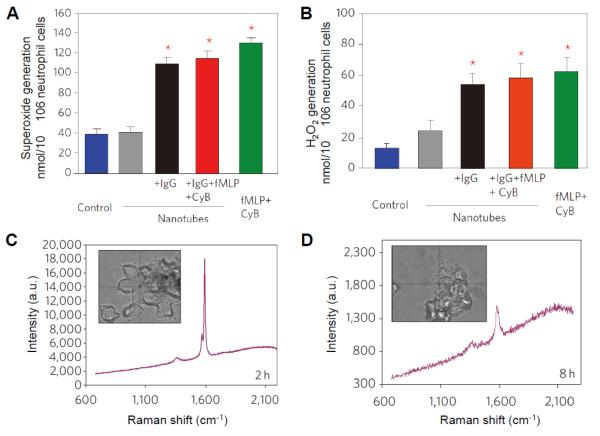
Figure 3.
(A, B) Quantitative assay of extracellular superoxide radicals (A) and H2O2 (B) generated by activated neutrophils. *Significant different from control (P<0.05); error bars represent standard deviations (s.d.).) (C, D) Raman spectra of neutrophils containing IgG-nanotubes after 2 h (C) and 8 h (D). Adapted from [26] Copyright Macmillan Publishers, Ltd. 2010.

