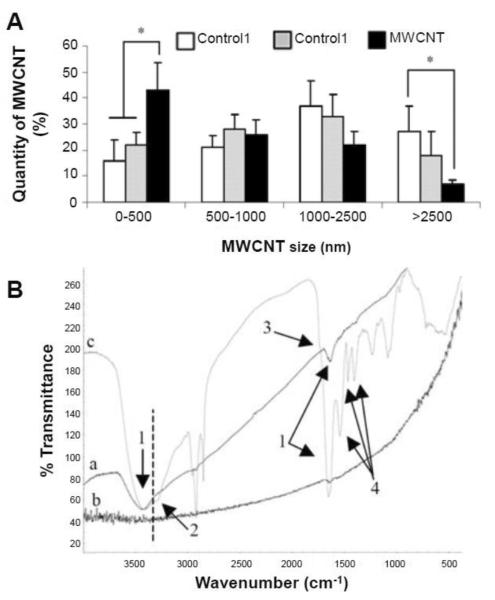
Figure 5.
(A) Length distribution of MWCNTs from different samples performed on at least 100 MWCNTs per sample. Control 1: MWCNTs along; Control 2: MWCNTs incubated for 15 days with suspension of lysed cells from broncheoalveolar lavage (BAL); MWCNT: MWCNTs injected to rats after 15 days. *Significant from control (p<0.05); error bars represent s.d. (B) Infrared spectra of samples from (a) Control 1, (b) Control 2, and (c) MWCNTs injected to rats after 15 days. Possible peak assignment: 1. OH from H2O, 2. OH from alcohol group, 3. low quantity of carbonyl group, 4. nitrogen functional group. Reproduced from [85].

