
Figure 6.
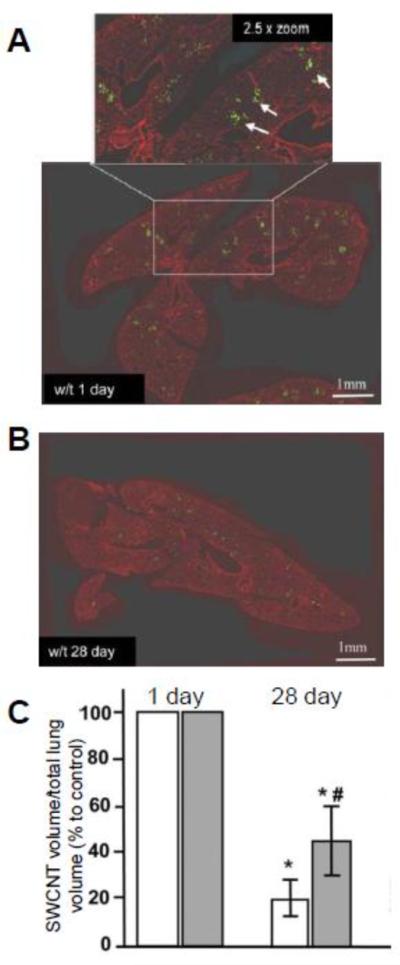
(A, B) Quantitative imaging of the lung tissue sections from w/t mice treated with SWCNTs illustrated with green pseudo-color after 1 day (A) and 28 days (B). Inset in A - higher magnification of a field with the presence of SWCNT (green punctuate spots pointed by white arrows). (C) Ratio of the volume of SWCNTs to the total lung volume for w/t and MPO k/o mice 1 day and 28 days after injection, respectively. Adapted from [28].