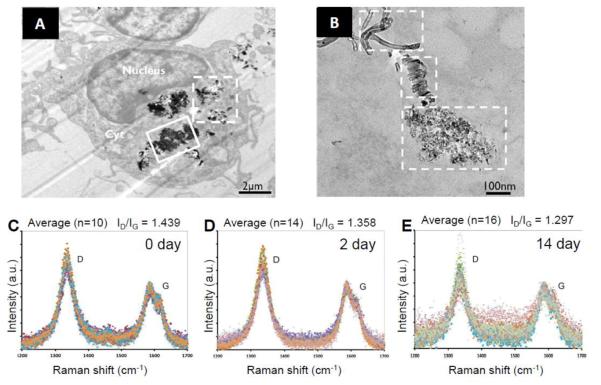
Figure 7.
(A) Low resolution TEM image of microglia with amine-functionalized MWCNTs localized intracellularly, both intact individualized MWCNTs (dash box) and structurally deformed MWCNT debris (solid) is exhibited. (B) TEM image with higher resolution showing co-existing intact MWCNTs (top), carbon sheets unraveled form MWCNTs (middle) and deformed MWCNT debris. (C, D, E) Raman spectra taken from the starting MWCNTs before injection and brain sections 2 days and 14 days after MWCNT injection. The corresponding D to G band ratios (ID/IG) are recorded. Reproduced from [86] Copyright Future Medicine 2012.

