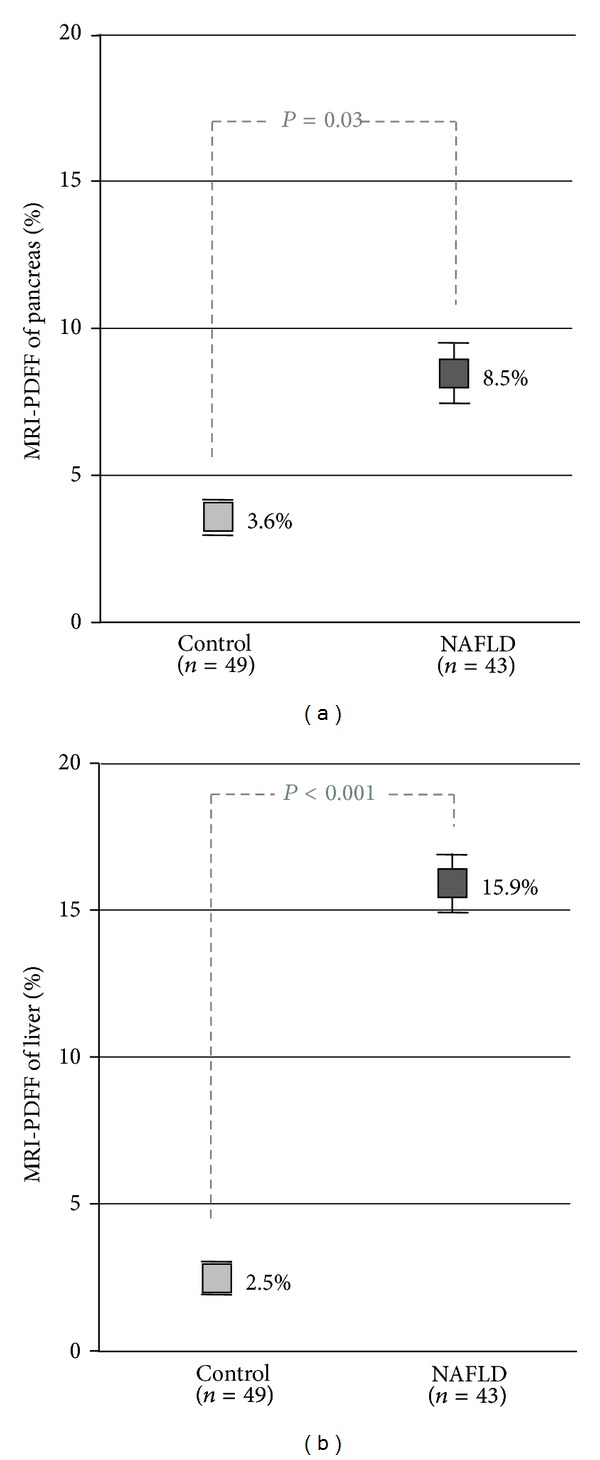
Figure 1.

MRI-estimated pancreatic and liver fat content in healthy controls versus NAFLD patients. Mean magnetic resonance imaging (MRI) proton-density-fat-fraction (PDFF) is shown for the pancreas and liver. Standard error bars are shown. P-value, determined using multivariable linear regression to correct for differences in age, sex, body mass index (BMI), and diabetes, is shown.
