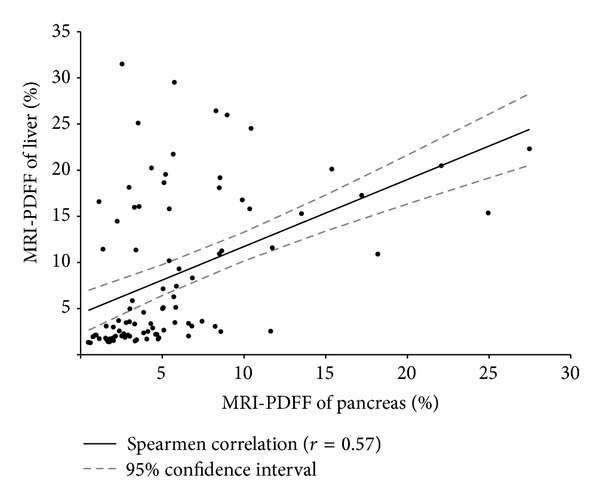
Figure 2.

Correlation of MRI-estimated pancreatic fat and liver fat content. Magnetic resonance imaging (MRI) proton-density-fat-fraction (PDFF) of liver (y-axis) and pancreas (x-axis) are shown for all patients in control and NAFLD groups. Spearman correlation coefficient determined with regression line and 95% confidence limits (r 2 = 0.32) are shown.
