
Figure 2.
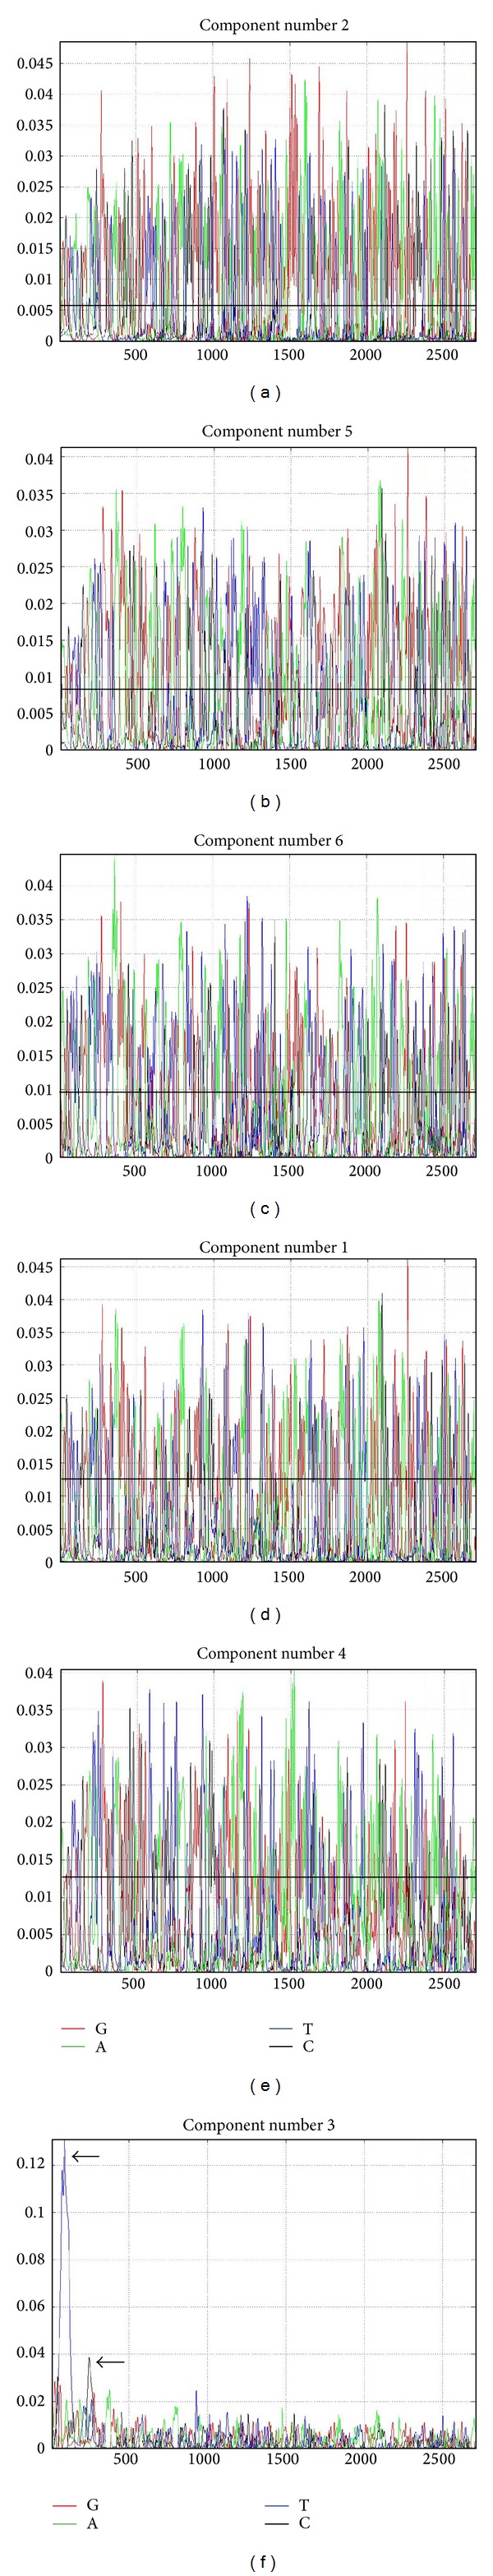
Spectra of the six components resolved by MCR analysis. Visual examination reveal components 2, 5, and 6 ((a)–(c)) to have well resolved spectra with low background sequences. Components 1 and 4 ((d) and (e)) also have well resolved spectra, although with somewhat higher background sequences than components 2, 5, and 6. Component 3 (f) has two high peaks (black arrows) and a poorly resolved spectrum.