
Figure 3.
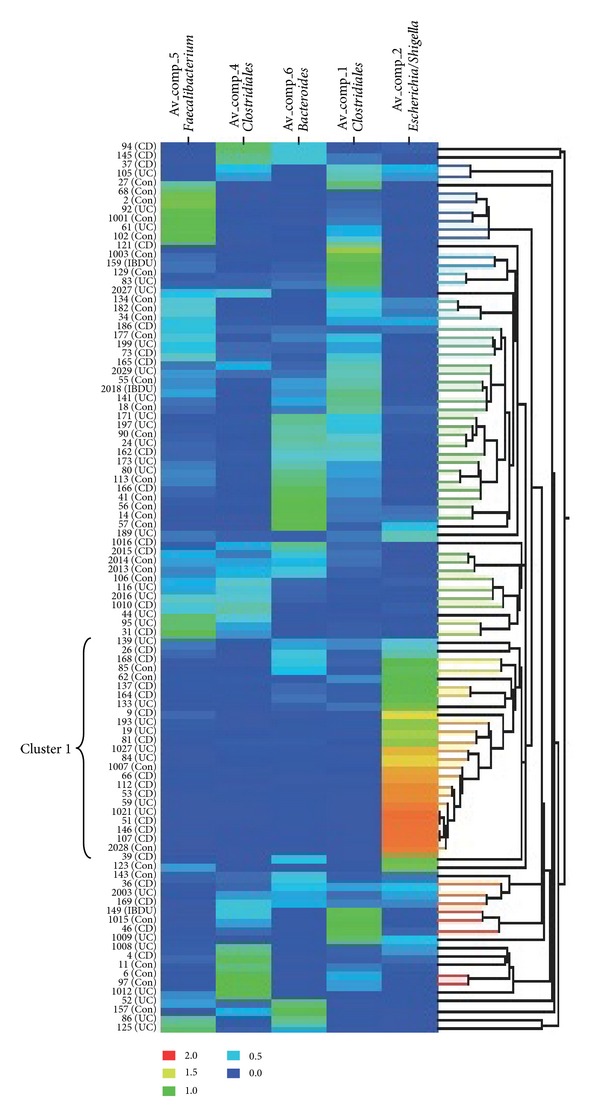
Data matrix of the amount of components 1, 2, 4, 5, and 6 in the stool samples. The graded colors indicate the abundance of a particular component in a sample. Red color indicates a high amount of the component, and blue color indicates a low amount of the component. To the left of the matrix, sample numbers are shown together with the diagnosis UC (Ulcerative colitis), CD (Crohn's disease), and Con (control).