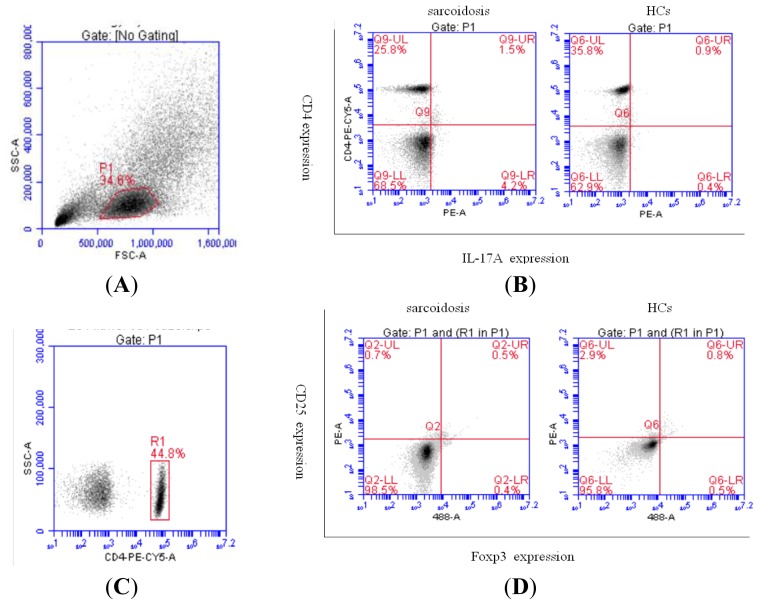
Figure 1.
Representative plots of Th17 and Treg cells in sarcoidosis patients’ and HCs’ peripheral blood by flow cytometry (A, B, C, D). (A) Physical parameter (forward scatter and side scatter) of lymphocytes in the peripheral blood; (B) Representative dot plots showing CD4+ T cells producing IL-17A in sarcoidosis patients’ and HCs’ peripheral blood; (C) Physical parameter (side scatter) and CD4 expression of lymphocytes in the peripheral blood; (D) Representative dot plots showing CD4+ T cells producing CD25 and Foxp3 in sarcoidosis patients’ and HCs’ peripheral blood.

