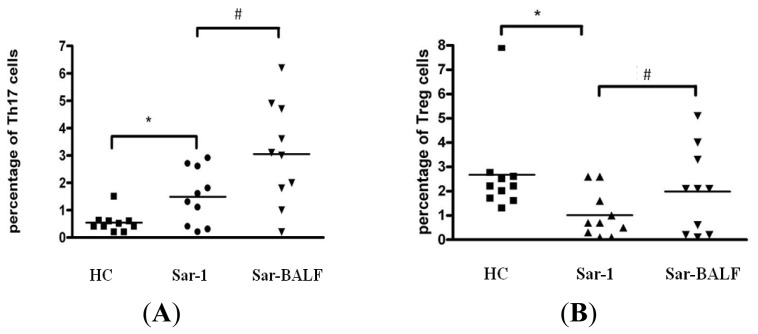
Figure 3.
The percentage of Th17 cells (A) in the PBMC of HCs and sarcoidosis patients (Sar-1), and in the BALF of sarcoidosis patients (Sar-BALF) (*p = 0.0139; #p = 0.0016). The percentage of Treg cells (B) in the PBMC of HCs and sarcoidosis patients (Sar-1), and in the BALF of sarcoidosis patients (Sar-BALF) (*p = 0.0286; #p = 0.0346). Each datum point represents an individual patient sample. Median values for each group are represented by the horizontal line.

