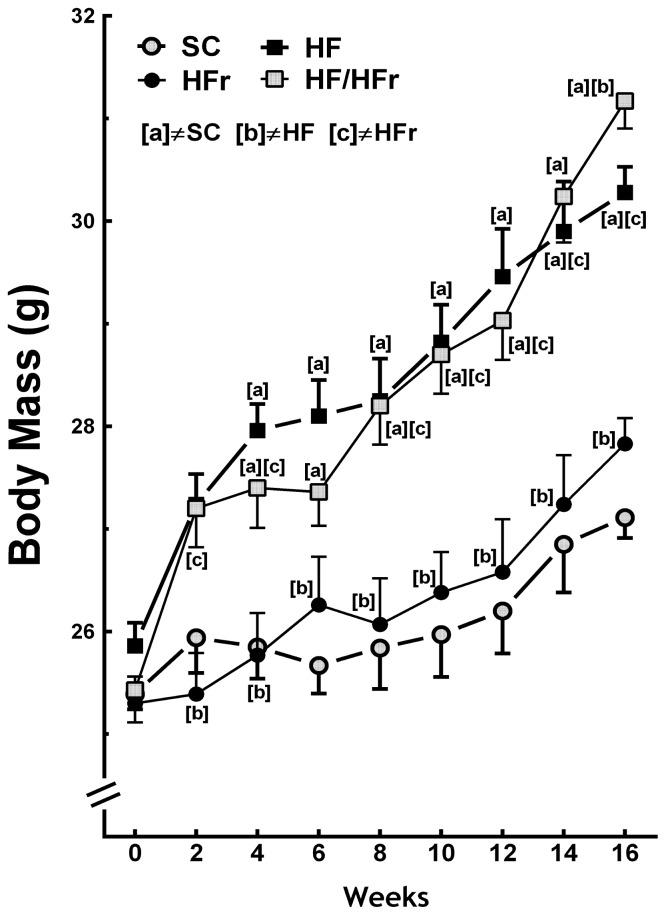
Figure 1.
Body mass. Diets were administered for 16 weeks. SC (standard chow group), HF (high-fat group), HFr (high-fructose group), HF/HFr (high-fat and high-fructose group). Values are means ± standard error. There was a significant difference (p ≤ 0.05 for the same week) compared with the a SC group; b HF group; and c HFr group.

