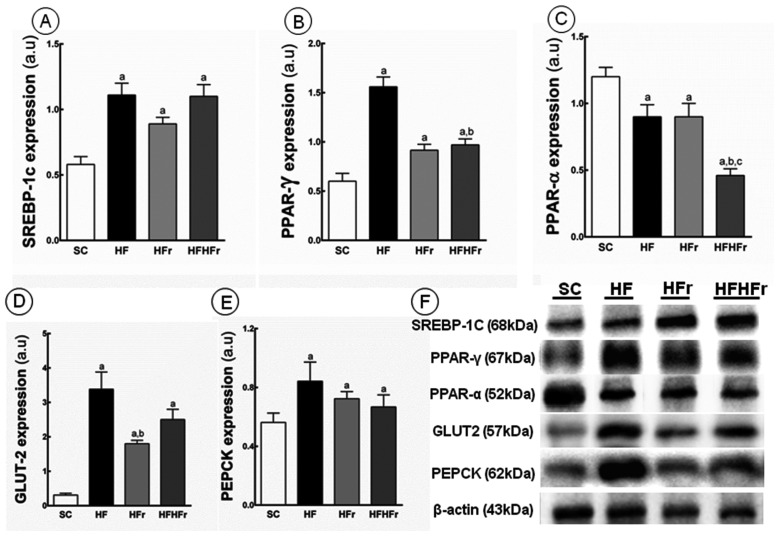
Figure 3.
(A) Sterol regulatory element-binding proteins(SREBP)-1c; (B) peroxisome proliferator-activated receptors (PPAR)-γ; (C) PPAR-α; (D) glucose transporter (GLUT)-2; and (E) phosphoenolpyruvate carboxykinase (PEPCK) protein expression in hepatic tissue normalized to the signal for β-actin (expressed in arbitrary units, a.u.); (F) representative bands of the proteins. Values are means ± standard error. There was a significant difference (p ≤ 0.05) compared with the a SC group; b HF group; and c HFr group.

