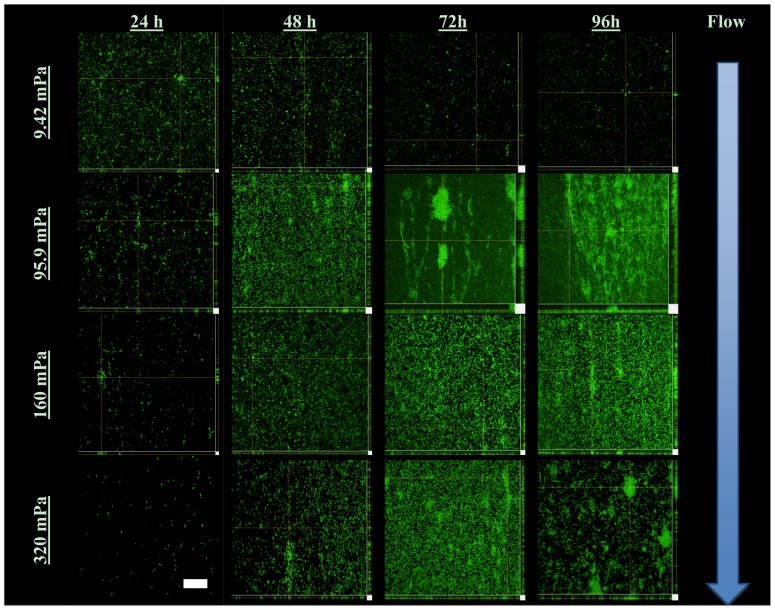
Figure 3.
Representative CLSM orthogonal projections of stacks of images taken of the various biofilms at 0.6 μm depth intervals. The main part of each image consists of a single 2D slice of the biofilm (xy-direction) whereas the smaller side panels below (xz-direction) and to the right (yz-direction) indicate a digital projection of the depth of biofilm biomass from the attachment surface to the bulk-liquid interface. A scale bar indicating 50 μm is included in the bottom left image.

