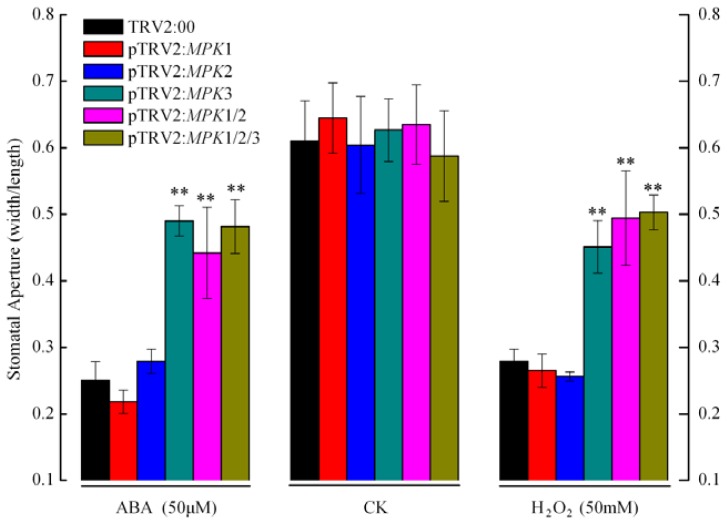
Figure 2.
Stomatal apertures (the ratio of width to length) of gene-silenced plants in response to ABA and H2O2. Leaves of control, individual gene-silenced (SpMPK1, SpMPK2, or SpMPK3) and combined gene-silenced (SpMPK1/SpMPK2 or SpMPK1/SpMPK2/SpMPK3) plants were incubated in stomatal opening solution for 2 h. Some of them were transferred to solutions containing 50 μM ABA or 50 mM H2O2 for 2 h and the others remained in the opening solution for control (CK). Stomata on the adaxial surface were observed by light microscopy. For each type of gene-silenced plants, at least 20 stomata from each sample of ten genes-silenced plants were measured. The data represent means ± SD. Asterisks indicate that the mean value is signficantly different from the control at p < 0.0001.

