Figure 2.
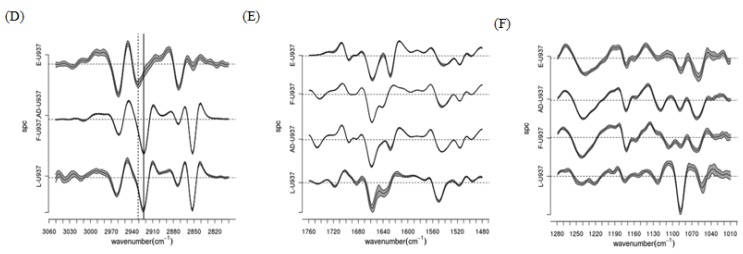
(A–C) Dendrograms of the classification of vector normalized second derivatives of spectra from L-, F-, E- and AD-U937 monocytes as obtained by HCA (Euclidean distances, Wards’ algorithm) in the regions of (A) lipids; (B) proteins-phospholipids; and (C) nucleic acids-carbohydrates; (D–F) centroids of the major classes identified by HCA in the (D) lipids; (E) proteins-phospholipids; and (F) nucleic acids-carbohydrates regions. Line thickness is proportional to standard deviation, (Reprinted with permission from [6]. Copyright 2012 American Chemical Society).


