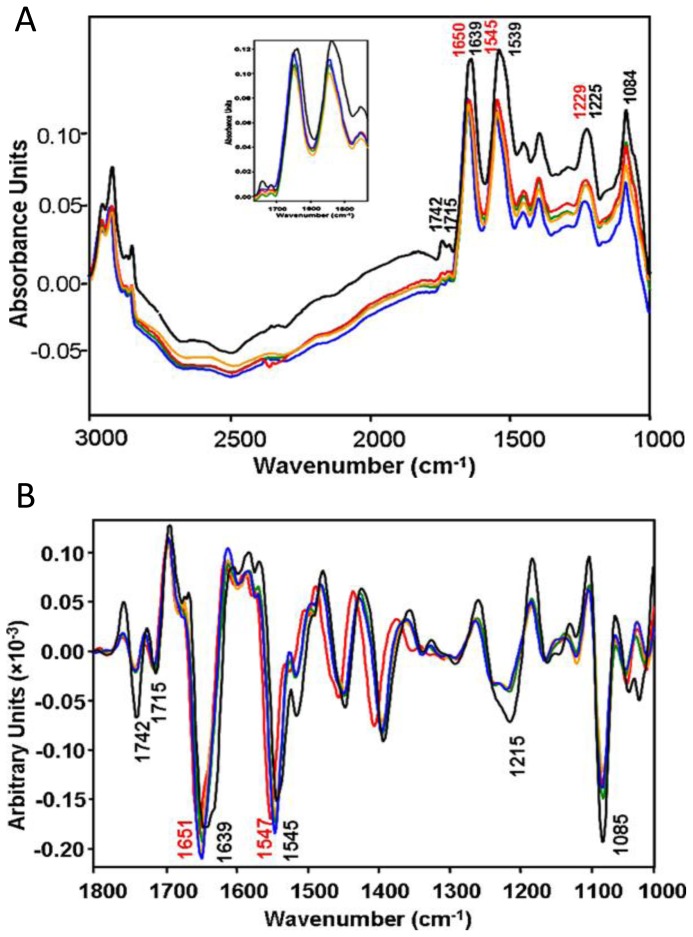
Figure 3.
(A) IR spectra of living leukemia cells taken in situ without the introduction of sodium arsenite (black) and after introduction of sodium arsenite for 40 min (orange), 60 min (blue), 100 min (green) and 120 min (red). The inset shows a focus on the carbonyl ester and amide region; and (B) shows second-derivatives from (A). The derivative-spectra clearly show shifts in the amide I (1600–1700 cm−1) and amide II (1500–1600 cm−1) bands between the control and arsenite-treated cells. (Reprinted with permission from [67]. Copyright 2010 Elsevier).

