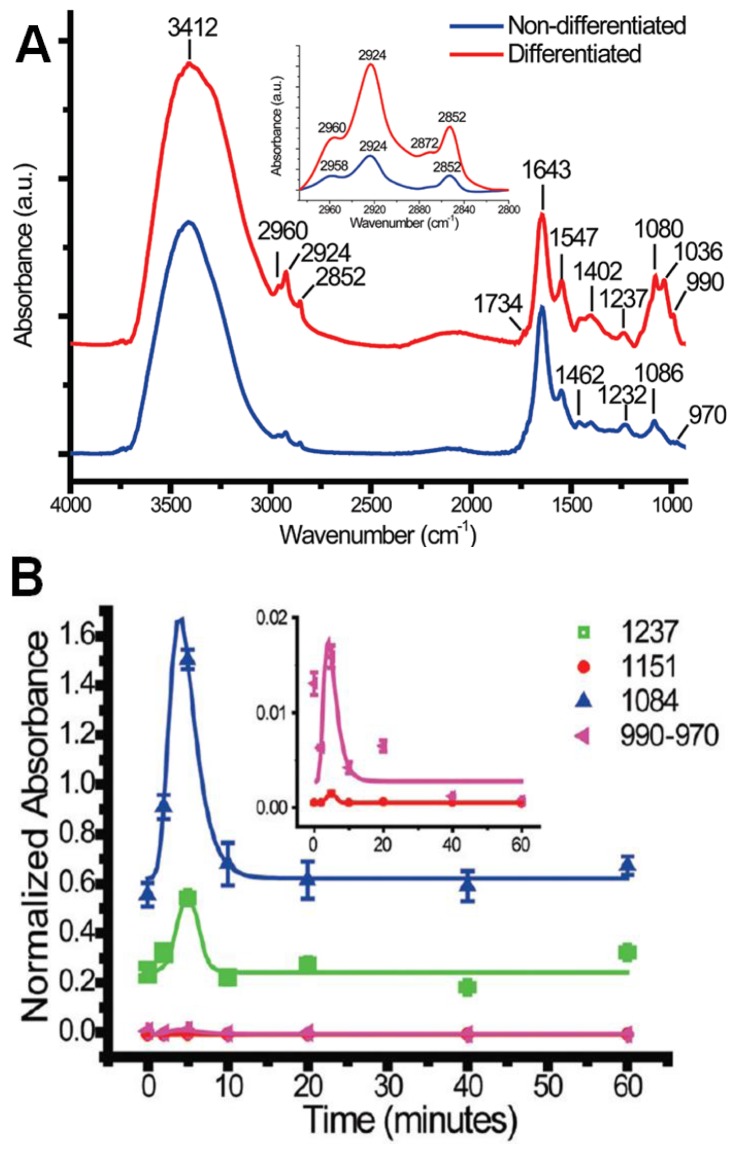
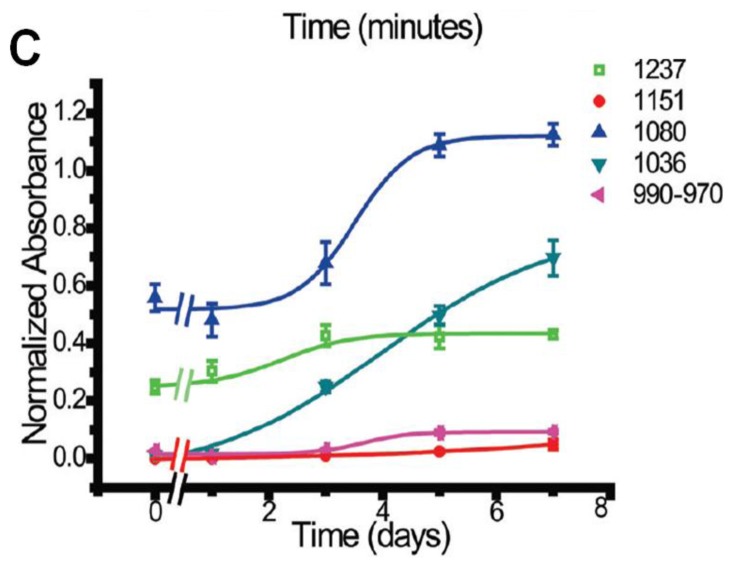
Figure 8.
(A) Comparison of IR absorption spectra of control (blue) and NGF-treated (red) PC12 cells; and (B,C) Time absorbance of bands in the fingerprint region from short-term (B) and long-term (C) NGF-treatments. (Reprinted with permission from [78]. Copyright 2012 American Chemical Society).


