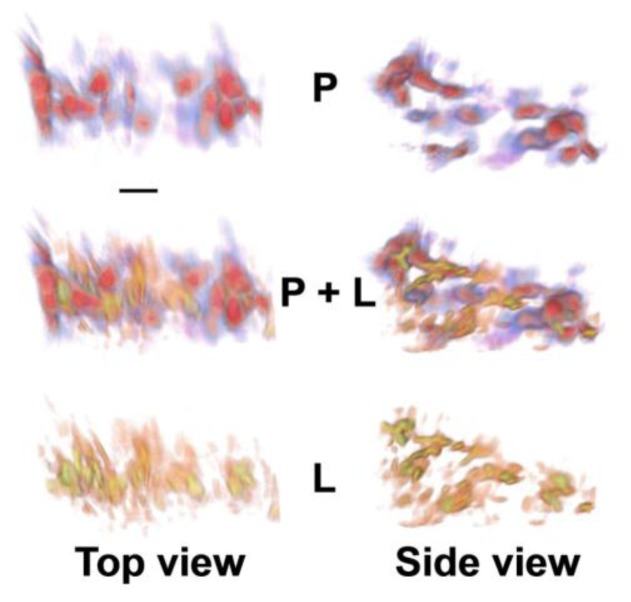
Figure 9.
Top and side views of 3D protein and lipid distributions for an embryoid body colony of stem cells. Volume renderings from reconstructions for the protein (P) amide I absorption band [1,650 cm−1; blue-red; (top)] and lipid (L)-specific bands [2,850 cm−1; orange-yellow; (side)] reveal three layers of cell bodies with inhomogeneously distributed lipids. The two spectral region reconstructions are shown independently and superimposed (P + L) to provide context for the images. Scale bar, 10 μm. (Reprinted with permission from [7]. Copyright 2012 American Chemical Society).

