Table 1.
In vitro data in both cellular replicon and NS3/4A protease enzyme assays of compounds 1–10 with the same skeleton selected from virtual screening. CC50, the 50% cytotoxicity concentration; MW, molecular weight.
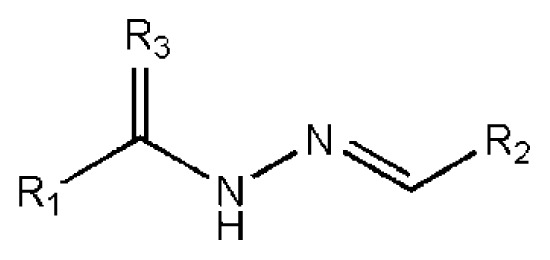
| ||||||||||
|---|---|---|---|---|---|---|---|---|---|---|
|
| ||||||||||
| No. | R1 | R2 | R3 | IC50 (μM) | CC50 (MTT) | SI a | %Inh. b | MW | LogPc | LogSc |
| 1 |
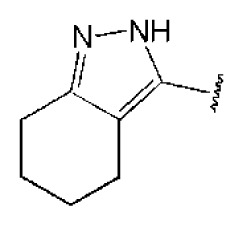
|
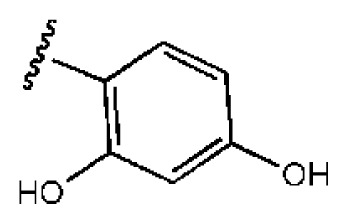
|
O | 4.69 | 0.46 | 0.10 | 96.7 | 300 | 0.27 | −3.01 |
| 2 |
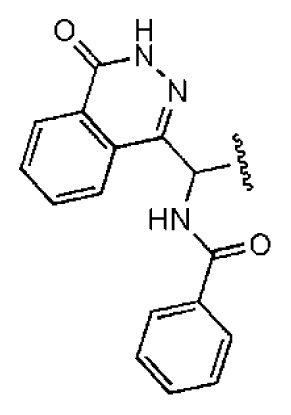
|
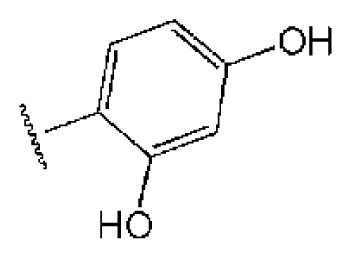
|
O | 11.2 | >50 | >4.46 | 77.9 | 457 | 1.95 | −3.90 |
| 3 |
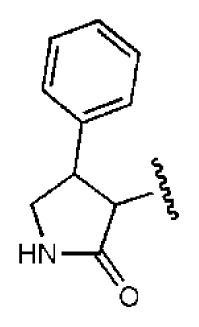
|
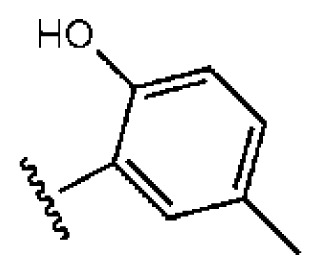
|
O | 13.4 | >50 | >3.73 | 337 | 2.75 | −3.69 | |
| 4 |
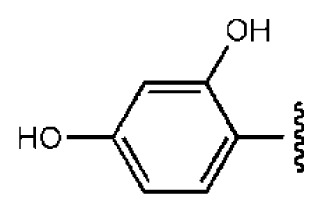
|
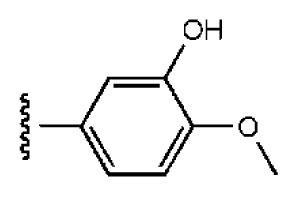
|
O | 15.3 | >50 | >3.27 | 56.9 | 302 | 2.2 | −2.48 |
| 5 |
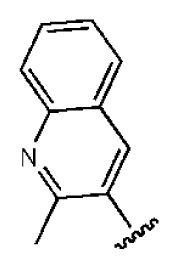
|
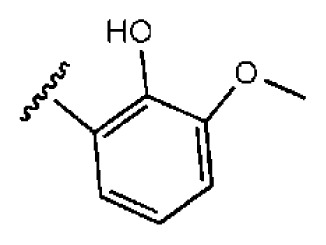
|
O | 3.01 | >50 | >16.61 | 335 | 3.17 | −4.05 | |
| 6 |
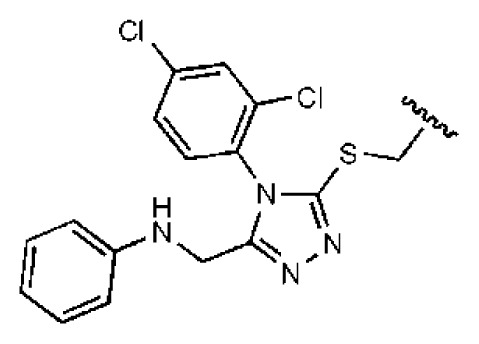
|
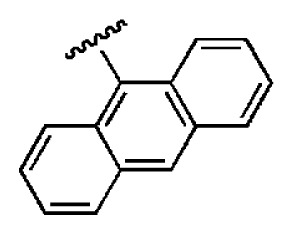
|
O | 5.04 | 14.8 | 2.94 | 48.1 | 612 | 7.08 | −10.6 |
| 7 |
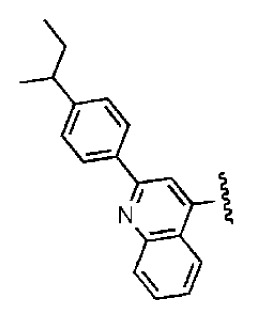
|
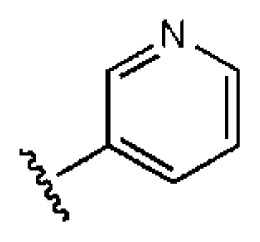
|
O | 4.14 | 11.8 | 2.85 | 64.3 | 409 | 5.84 | −5.53 |
| 8 |
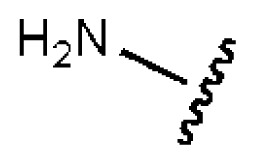
|
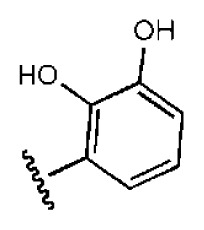
|
S | 6.23 | 1.12 | 0.18 | 211 | 1.51 | −1.89 | |
| 9 |
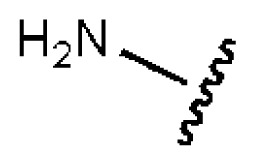
|

|
S | 21.1 | >50 | >2.37 | 33.7 | 211 | 1.53 | −1.03 |
| 10 |
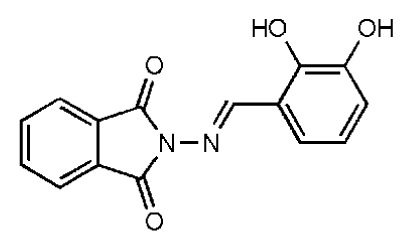
|
7.07 | >50 | >7.07 | 282 | 2.18 | −2.5 | |||
| CSA | 0.31 | >50 | >160 | |||||||
Selectivity index (SI): the ratio of CC50/IC50;
%Inh.: the inhibition percentage at a concentration of 50 μM in biochemical protease assay;
LogP, LogS: the values were provided by SPECS.
