Figure 3.
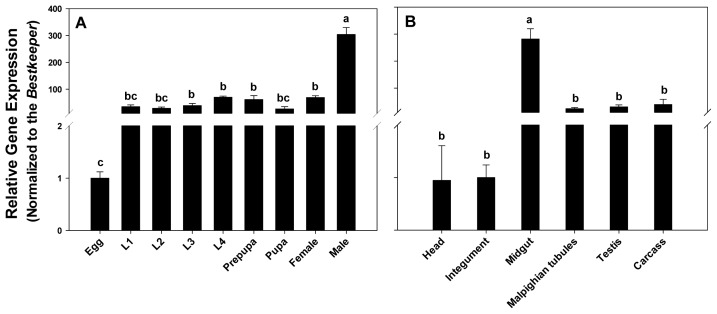
Expression profiles of PxPgp1 in different developmental stages and tissues. Distribution of PxPgp1 in different developmental stages of P. xylostella is depicted in (A). The mRNA quantity is expressed relative to the egg stage. L1 to L4 denote the first- to fourth-instar larvae, respectively. The relative expression levels of Pgp in various tissues of fourth-instar larvae are shown in (B). Data are presented as mean ± SE for three independent replicates. Letters denote levels of statistical significance, according to Tukey’s test (p < 0.05).

