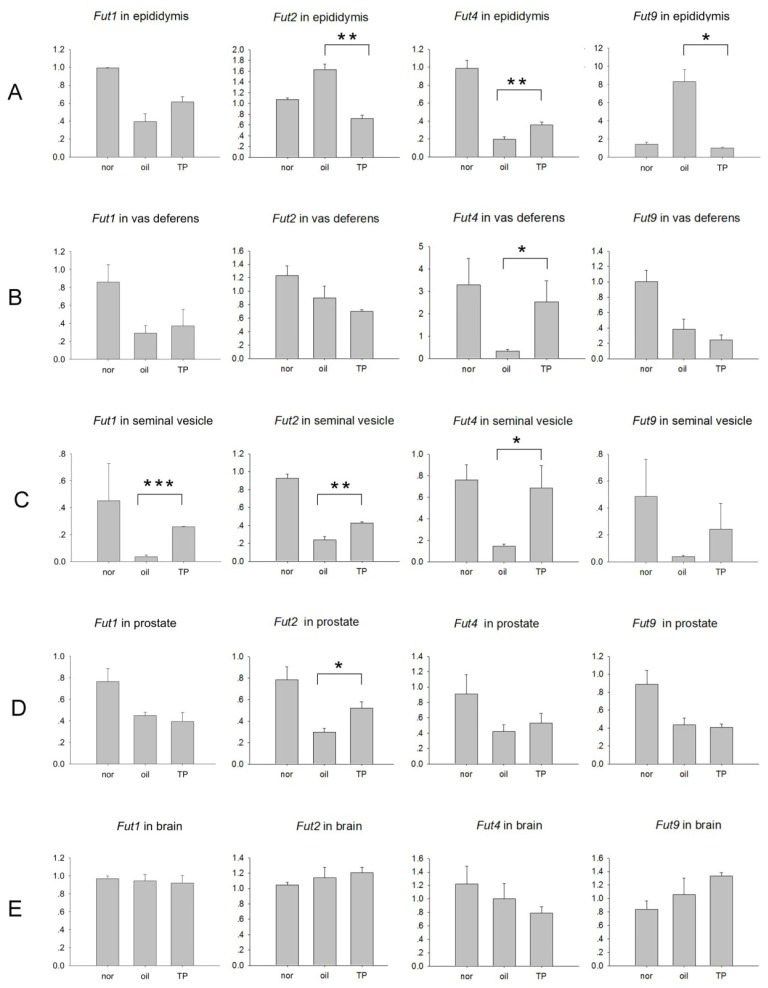
Figure 2.
The expression of Fut1, Fut2, Fut4 and Fut9 in (A) epididymis; (B) vas deferens; (C) seminal vesicle; (D) prostate and (E) brain from animals in the “7 days castration + 2 days androgen replacement” castration model. Nor: normal non-surgery control; oil: oil vector control; TP: testosterone propionate replacement. Y-axis: mRNA expression of indicated genes using glyceraldehyde phosphate dehydrogenase (GAPDH) as the internal control. Data are expressed as the means ± SEM (n = 3). *p < 0.05; **p < 0.01; ***p < 0.001, as compared with the corresponding oil-treated castrated control.

