
Figure 1.
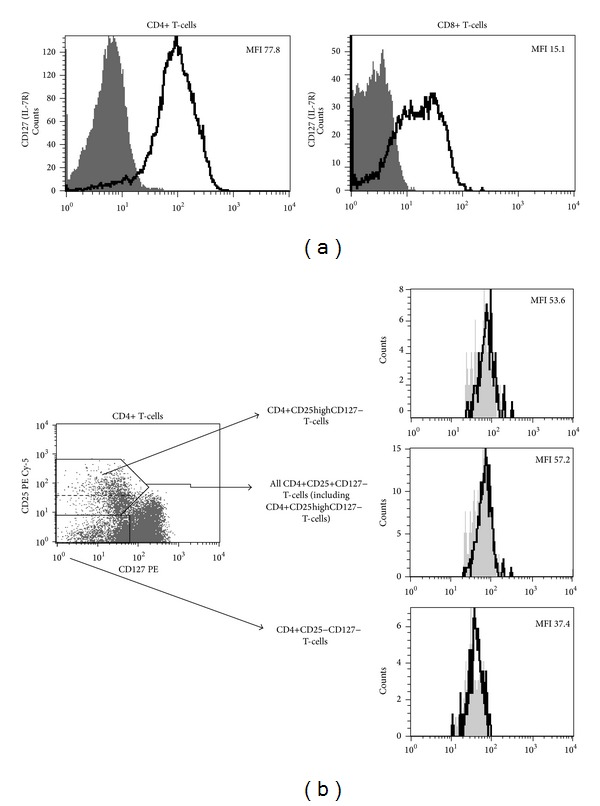
Representative histograms and plots characteristic for studied individuals. (a) Flow cytometric analysis of mean fluorescence intensity of CD127 expression on CD4+ and CD8+ T-cells. Thick black lines represent staining with anti-CD127 monoclonal antibody, grey areas represent fluorescence-minus-one controls. (b) Left panel: dot plot demonstrates staining method used for delineation of CD4+CD25+CD127− T-cells (upper black box) and CD4+CD25-CD127− T-cells (bottom black box). Dashed line within upper black box delineates CD4+CD25highCD127 T-cells within all CD4+CD25+CD127− T-cells. Right panel: histograms representing FoxP3 expression within different T-cell subsets (black lines). Grey areas represent isotype controls. Values are for mean fluorescence intensity (MFI) of FoxP3 expression within different T-cells subsets.