
Figure 3.
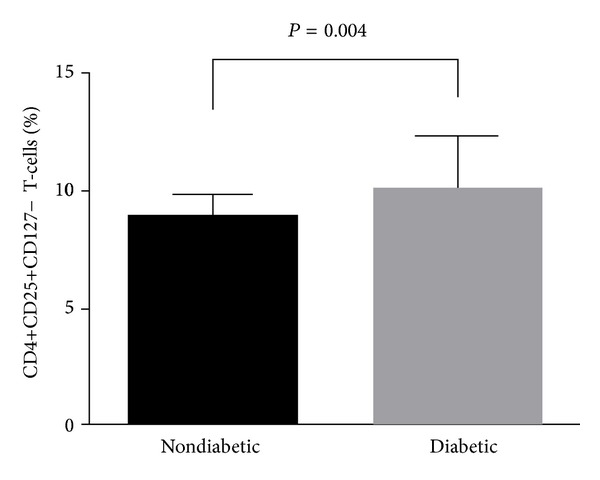
Comparative analysis of frequencies of CD4+CD25+CD127− T-cells in healthy children and T1D children. Bars represent medians while whiskers represent interquartile range.
Official websites use .gov
A
.gov website belongs to an official
government organization in the United States.
Secure .gov websites use HTTPS
A lock (
) or https:// means you've safely
connected to the .gov website. Share sensitive
information only on official, secure websites.
Comparative analysis of frequencies of CD4+CD25+CD127− T-cells in healthy children and T1D children. Bars represent medians while whiskers represent interquartile range.