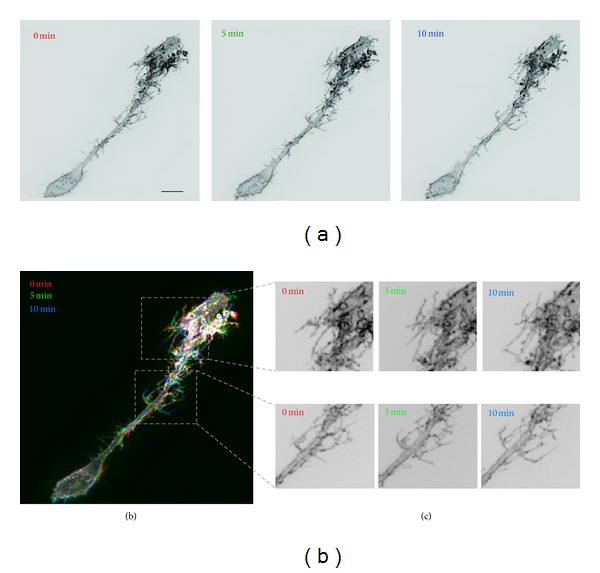
Figure 1.

Radial glia process movement in vivo is apparent over a timescale of minutes. (a) Maximum intensity projections of two-photon microscope z-series images of a radial glia cell expressing farnesylated EGFP in the intact tadpole brain. (b) RGB overlay of the time-lapse images of a radial glia cell where red denotes the position of the cell at 0 minutes, green after 5 minutes, and blue after 10 minutes of imaging. (c) Magnified images of several highly dynamic sites from the radial glial cell shown in (b). Scale bar = 10 μm.
