Figure 3.

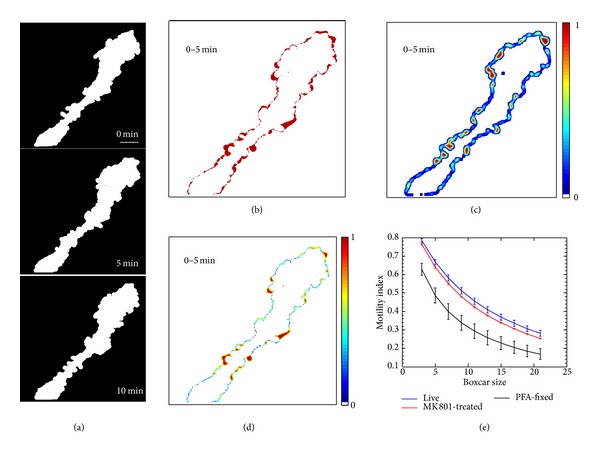
Analysis of pixel redistribution using boxcar averaging. (a) Preprocessed images from 0, 5, and 10 minutes time points. (b) Subtracting consecutive images from one another creates a map of the redistributed pixels between time points, shown in red. (c) Boxcar averaging of the pixel redistribution images from (b) using 9 × 9 pixel window. (d) Result of multiplication of the images in (b) and (c). The average of the nonzero pixel values in this image is used to calculate the cell motility index. (e) Plot of motility index values obtained for the datasets in Figures 5(c), 5(d), 6(c), and 6(d) using a range of different boxcar sizes. Motility values in the different conditions are most clearly separated when a 9 × 9 pixel boxcar size is used. Scale bar = 10 μm.
