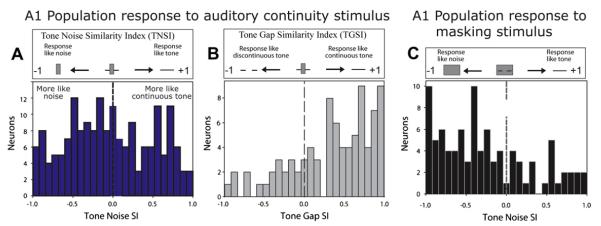
Fig. 4.

Population statistics of A1 neuron responses during perceptual continuity and masking. (A) Distributions of tone-noise-similarity-index (TNSI) – which compare whether the response to a discontinuous tone with noise is more like the responses to a complete tone by itself (positive values) or to the noise by itself (negative values). For the interrupting noise that elicits the continuity illusion the neuronal population in A1 represents both the noise (negative TNSI) and the illusory continuous tone (positive TNSI). (B) For neurons representing the tone (negative TNSI values from A) the tone-gap similarity index (TGSI) was calculated and plotted. Positive values are consistent with the neurons responding as if the tone were continuous; negative values are consistent with the neurons responding as if the tone were discontinuous. This plot shows that the neurons that represent tones respond as if the tone were continuous under conditions that elicit illusory continuity. (C) For surrounding noise that elicits masking the neuronal population in A1 responds as if only a noise is detected (negative TNSI). The TNSI values for interrupting noise for the example neurons in Fig. 3 are +0.60 for Fig. 3B and +0.63 for Fig. 3C.
