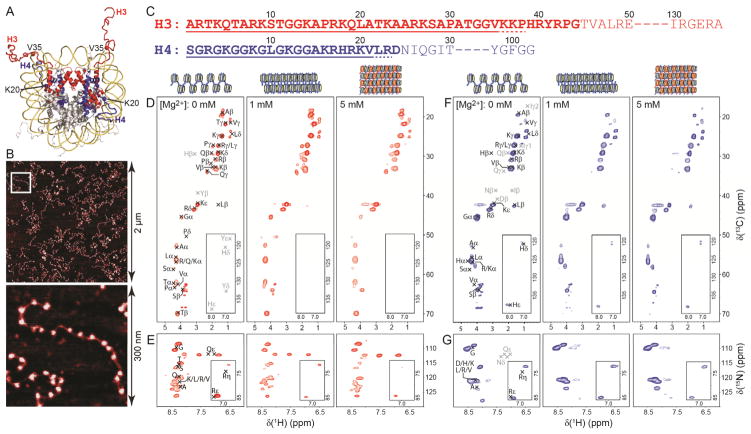
Figure 1.
(A) Nucleosome crystal structure (PDB entry 1KX5).4 Histones H3 and H4 are colored in red and blue, respectively, with selected residues located near the N-terminal tail boundaries highlighted. (B) Representative atomic force microscopy images of 17-mer nucleosome arrays used for the NMR studies. (C) Amino acid sequences of histones H3 and H4. N-terminal residues that are relatively unstructured in nucleosome core particle crystals are highlighted in bold. Residues determined in the present study to comprise the flexible N-terminal H3 and H4 tails in highly concentrated 17-mer nucleosome arrays irrespective of the degree of array compaction are underlined with solid lines. Additional residues that possibly belong to the dynamically disordered histone tail domains but cannot be unambiguously identified from the NMR data are underlined with dashed lines. (D,E) 2D 1H-13C (D) and 1H-15N (E) correlation spectra of 17-mer nucleosome arrays containing 13C,15N-enriched H3 and prepared with 0, 1 and 5 mM Mg2+, corresponding to extended, folded and aggregated chromatin conformation, respectively, as indicated. The spectra were recorded at 500 MHz 1H frequency, 11.111 kHz MAS rate and 30 °C using a 2D refocused INEPT pulse scheme described in detail previously.26 Each spectrum was recorded with acquisition times of 18 ms and 30 ms in the 1H and 13C/15N dimensions, respectively, and a total measurement time of ~48 h. Resonance assignments based on the average chemical shift values in the BioMagResBank database corresponding to residues located in the flexible N-terminal histone tail are labeled in black font. Indicated in gray font are the approximate locations of signals from unique residues bordering the flexible tail that would be observed if those residues were sufficiently mobile. Note that several narrow signals visible at 13C frequency of ~65–70 ppm, particularly for the 0 mM Mg2+ sample, arise from residual sucrose from the sucrose gradient purification procedure. (F,G) Same as panels (D,E) but for 17-mer nucleosome arrays containing 13C,15N-labeled H4.

