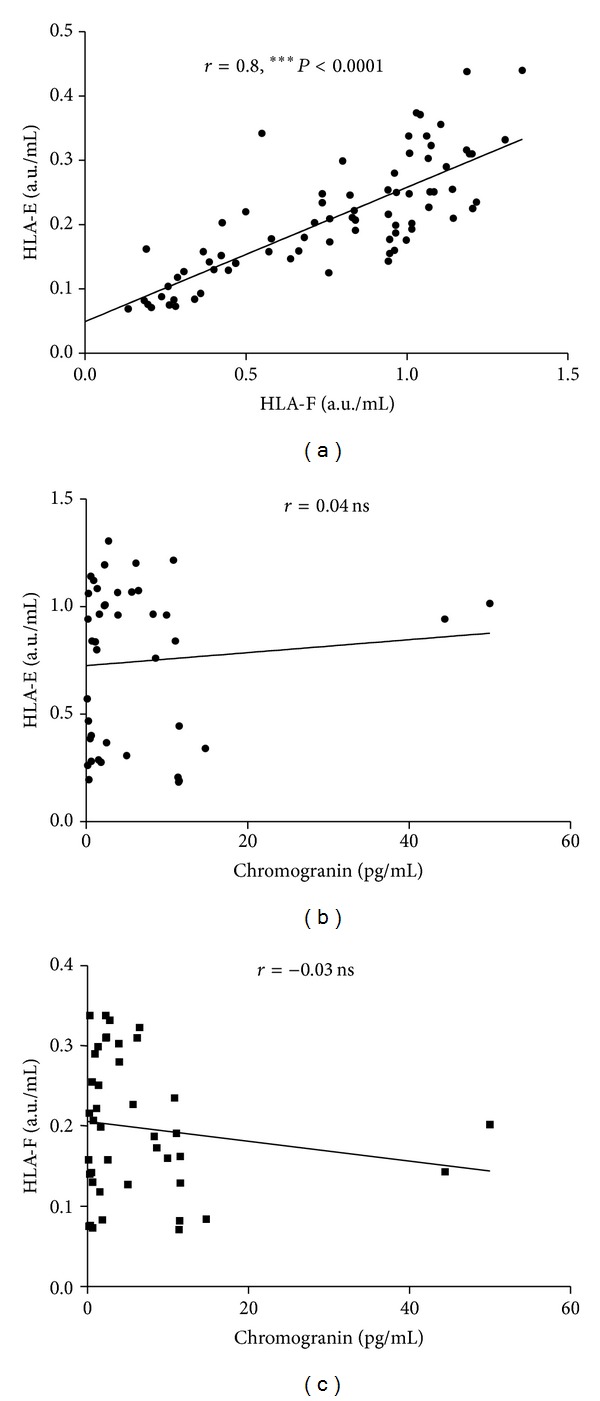
Figure 3.

Correlations between plasma levels of sHLA-E, sHLA-F, and chromogranin. Correlation between levels of sHLA-E and sHLA-F (a), chromogranin and sHLA-E (b), and chromogranin and sHLA-F (c). Each point represents single observations. Linear regression and Spearman r values are shown. P values are indicated when correlation is significant.
