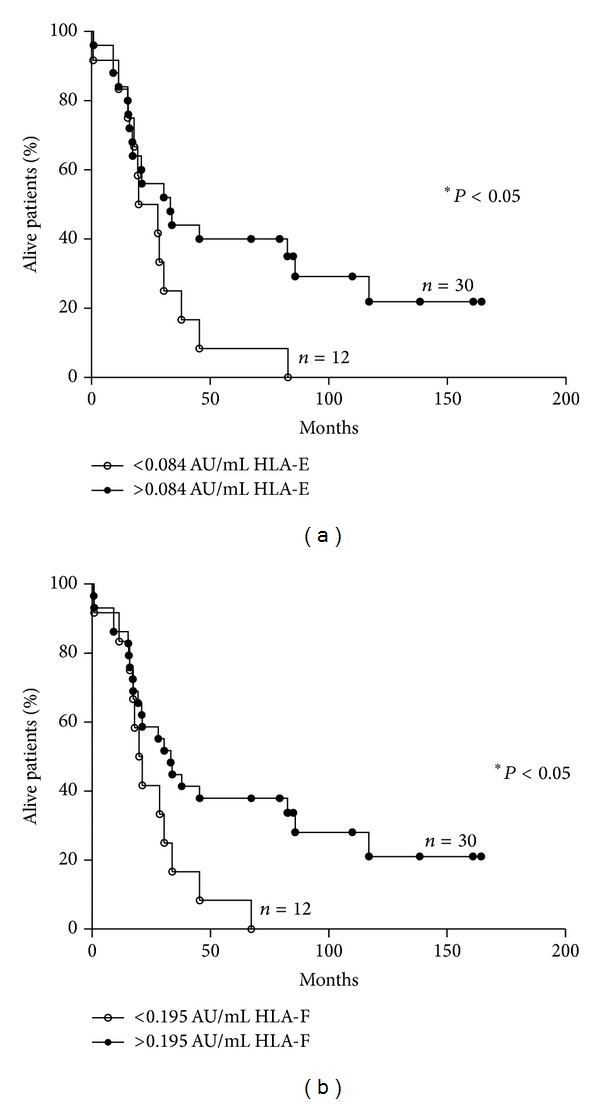
Figure 5.

Kaplan-Meier plots of OS of patients with metastatic NB stratified by levels of sHLA-E and sHLA-F. OS of patients with metastatic NB stratified according to levels of sHLA-E (a) and sHLA-F (b) above (black dots) or below (white dots) the ROC cut-off levels. Y-axes indicate proportion of alive NB patients, whereas X-axes indicate survival time (months). P values are indicated where the difference is significant.
