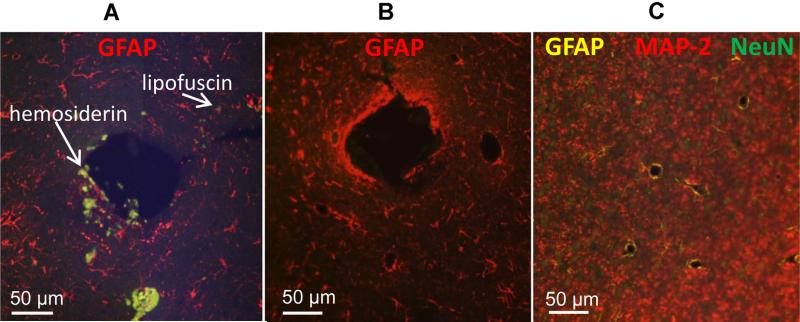
Fig. 6.
Immunostaining quality comparison between untreated and treated 5 μm-thick rabbit brain specimens. Specimens were photo-irradiated for 4 h at a distance of 1 mm away from the LED panel surface. The large hole represents an electrode shaft area with AAFs. (A) GFAP staining (Qdot® 655 nm, red) on untreated specimens with AFFs (white arrows). (B) GFAP staining (Qdot® 655 nm, red) on treated section showing no AAFs present. (C) Triple staining for GFAP (Qdot® 585 nm, yellow), NeuN (Qdot® 525 nm, green), and MAP-2 (Qdot® 655 nm, red) following treatment. Note the absence of AAFs in the treated groups (B and C). Samples were imaged on a widefield fluorescence scope (Olympus Inc.) using a multiband excitation (495 nm) and emission filter (520–700 nm) for the Qdot® fluorophores used. (For interpretation of the references to color in this figure legend, the reader is referred to the web version of this article.)

