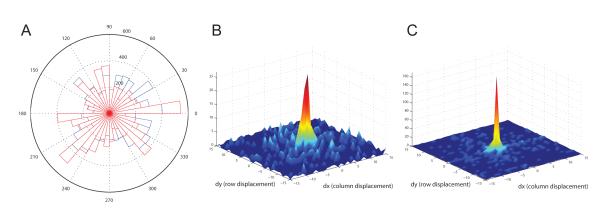
Figure 6.
Motion vector analysis for salivary gland data set shown in Figure 5. (A) Weighted histogram of motion vector angles for one slice. Histogram for unregistered image is show in blue, while histogram for registered image is shown in red. Motion vector analysis was performed using a 31 × 31 search window and 8 × 8 blocks size. (B) 3D distribution plot of motion vector displacements before registration. (C) 3D distribution plot of motion vector displacements after registration.

