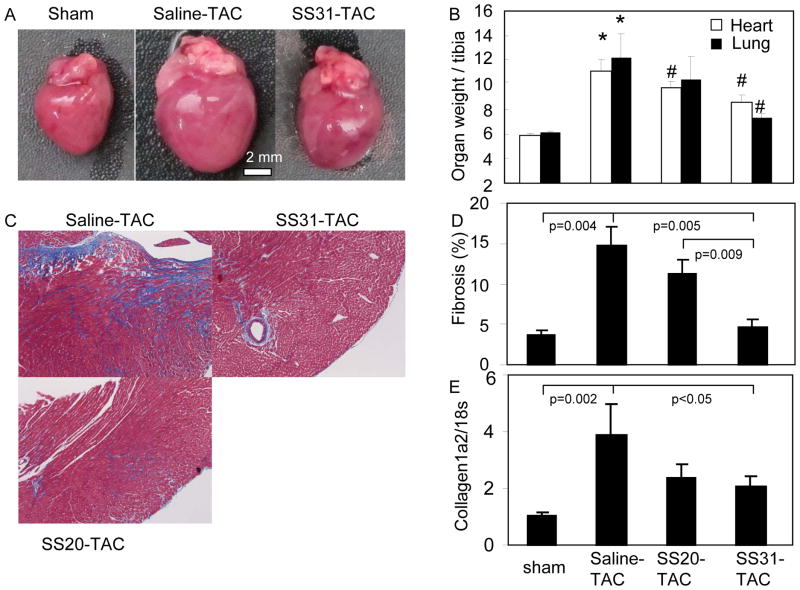
Figure 2. Pathology of TAC-induced heart failure.
(A) Representative images of sham, saline-TAC and SS31-TAC treated hearts. (B) Heart weight and lung weight normalized to tibia length (mg/mm). (C) Representative Masson trichrome stain of the heart displayed marked interstitial fibrosis (blue) in saline-TAC hearts. (D) Quantitative analysis of fibrosis (% myocardial area) revealed that fibrosis in saline-TAC was significantly attenuated by SS31, but not by SS20 or SS48. (E) Quantitative PCR of collagen1a2 normalized to 18s. *p<0.05 for sham vs. saline-TAC, #p<0.05 TAC-SS vs. saline-TAC.

