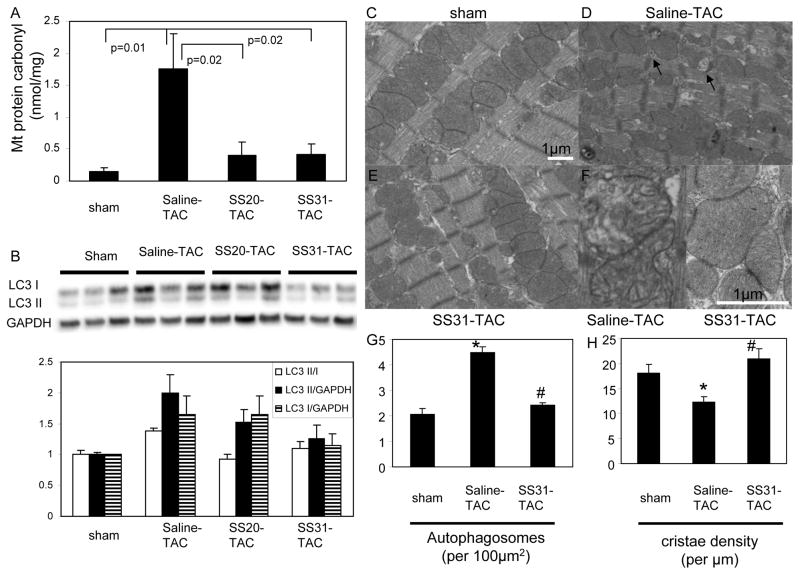
Figure 3. Mitochondrial damage in TAC-induced heart failure.
(A) Mitochondrial protein carbonyl content (nmol/mg) measured by enzyme immunoassay. (B) Western blots of microtubule associated protein light chain 3 (LC3) demonstrated significant increase in LC3-II, a marker of activated autophagosomes, in saline-TAC hearts, which was significantly attenuated in SS31-TAC and partially attenuated in SS20-TAC hearts. Representative electron micrograph of cardiac apices in sham (C), saline-TAC (D) and SS31-TAC (E) demonstrated increased numbers of damaged mitochondria and autophagosomes (arrows) in saline-TAC hearts. (F) Higher magnification of mitochondria showed disrupted cristae in saline-TAC hearts (left) compared to normal cristae in SS31-TAC hearts (right panel). (G) Quantitative analysis of the number of autophagosomes (per 100μm2) and mitochondrial cristae density (cristae/μm). *p<0.05 for sham vs. saline-TAC, #p<0.05 SS31-TAC vs. saline-TAC.

